When asked “what’s your favorite food?”, it’s no surprise pizza is a top contender. Pizza’s popularity in the United States has consistently climbed throughout the decades, with the first pizza pie being delivered in 1889. Pizza chains and local favorites can now be found around nearly every corner. In fact, 350 slices of pizza are consumed every second in the U.S., and 93% of Americans order pizza at least once a month. Pizza is a timeless classic that will always be sought out – and drive profit for your restaurant.
In celebration of Pi Day, we dug into the 1 billion+ orders Otter has processed to discover pizzeria and pizza chain trends. Read on to learn about shifts and growth in the pizza industry and uncover three ways to increase your pizzeria or pizza chain’s cash flow.
Pizza chain trends: location count
As mentioned above, pizza’s popularity continues to climb, which means more locations are opening up year after year. From 2022 to 2023, the pizzeria location count across the U.S. increased by 4.97%. In 2023, pizzerias made up 5.84% of all restaurants in the US. Not only are there many pizzerias, but consumers are loving what they’re offering. Most of those pizzerias are highly rated – with an average rating of 4.43 stars.

Pizza chain trends: coverage by state
While New York may have the best pizza, it doesn’t have the most pizzerias. See which states have the highest and lowest density of pizza chain and pizzeria locations. And if you’re in one of the least pizzeria-covered states, consider taking advantage of it and becoming the go-to spot for eaters.
States with the highest density of pizzerias relative to general restaurants:
- New Hampshire – 9.04% of all restaurants
- West Virginia – 8.94% of all restaurants
- Iowa – 8.29% of all restaurants
- Nebraska – 7.62% of all restaurants
- Maine – 7.58% of all restaurants
States with the least pizzeria coverage:
- Hawaii – 1.51%
- California – 1.67%
- Texas – 2.30%
- Florida – 2.30%
- Georgia – 2.33%

Pizza chain trends: order ratings
As with any other cuisine type, the quality of a pizzeria can be measured by order ratings. Keep in mind that the blend of service, menu options, prices, and of course the pizza itself all factor into how customers rate restaurants.
The states with the top-rated pizzerias are:
- New Hampshire
- Maine
- Wisconsin
- Kentucky
- Oklahoma
The states with the lowest-rated pizzerias are:
- Wyoming
- South Carolina
- Montana
- Kansas
- Pennsylvania
Pizza chain trends: popular toppings
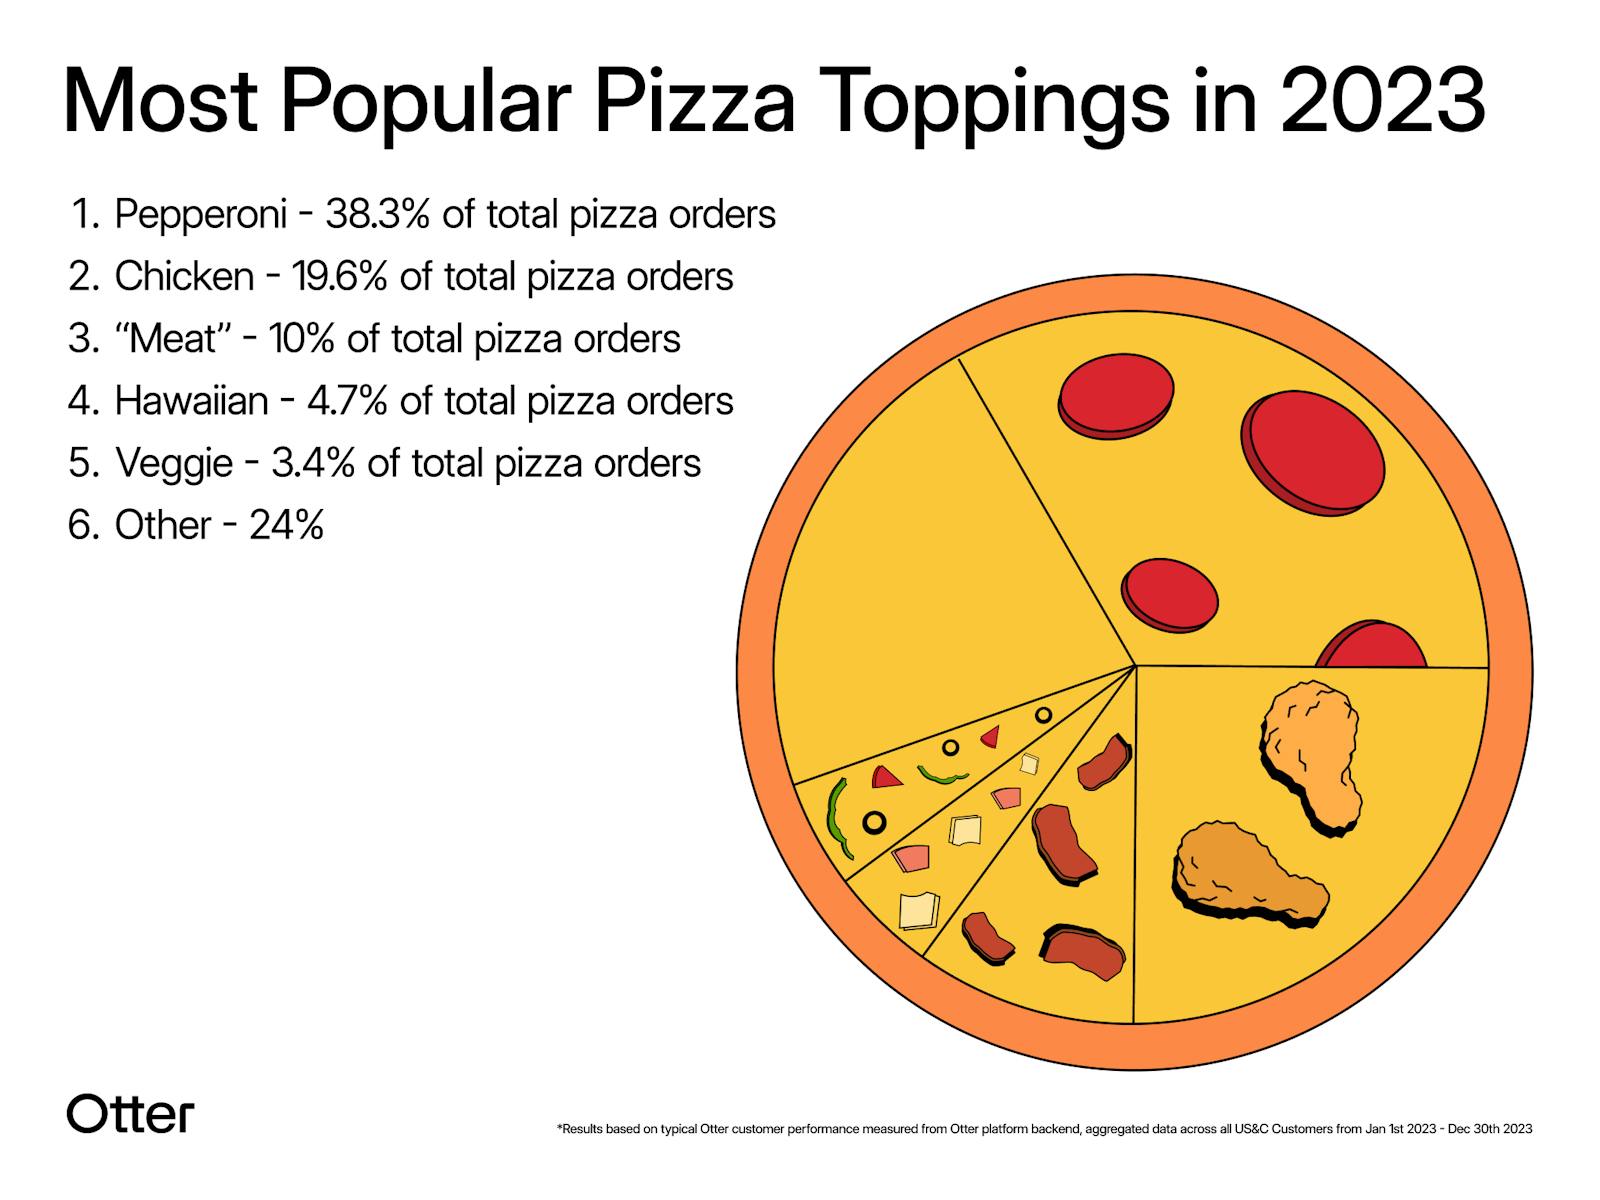
Pineapple on pizza, hamburger pizza, or even the hot honey craze have kept eaters excited about what’s coming next in the pizza industry. But even as the new trends arise, it’s the classics that continue to be the most-loved. Pepperoni is the most ordered pizza type, followed by chicken, “meat”, and Hawaiian. Even as you test new items on your menu, make sure these popular toppings are front and center to meet customer preferences.

If there’s one thing we can all agree on, it’s that pizza is a welcome addition to any family gathering, work event, or even date night. Use these stats to make the most of your business, and fill out the form below for tangible ideas on how to use these trends to make your pizzeria more money.
And if you’re looking for ways to improve your order management and rank higher on delivery apps, book a demo with the Otter team. The average pizzeria sees a 17.2% reduction in canceled orders* after just one year of using Otter. We’d love to help supercharge your pizza business.
*Results based on typical Otter customer performance measured from the Otter platform's backend, aggregated data across all US&C customers from Jan 1st, 2023-Dec 30th, 2023.
Pizza Chain Trends
Fill out this form for tips on how to make your pizzeria more money.


