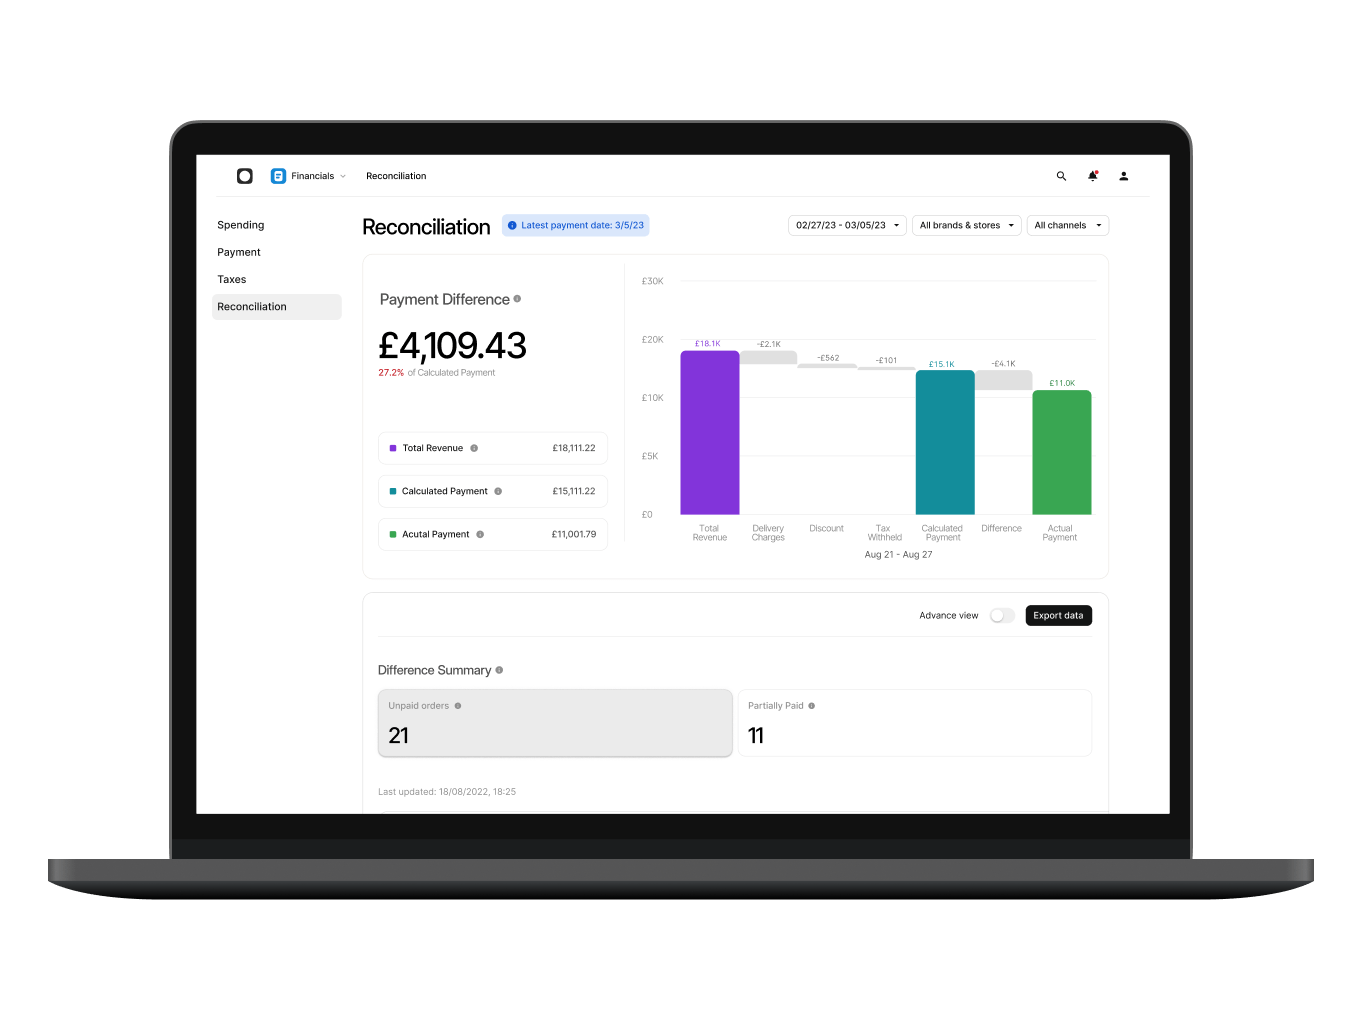
Otter customers, here's how to make the most of the reporting tools within your Otter platform.
As a restaurateur, you know that analysing your performance data is key to optimising your business and increasing your sales, but it shouldn’t feel like a full-time job. You got into the restaurant industry to make great food and keep people happy – and we want to help keep it that way. Otter’s Reports dashboard makes keeping up with your performance simple, so you can get back to doing what you love. The best part? Our Reports feature is available to every Otter customer – at no extra cost. Before we jump into how the tool works, let’s go over a quick reminder of why tracking your restaurant’s performance is important to your business.
The importance of data in increasing your restaurant's delivery profit
As a restaurant owner, making decisions is a big part of your job, but how many of them are based on data? Let’s think about this: if your restaurant offers delivery, you're already collecting hundreds of pieces of data every day. You know what your customers order most; you have insight into your average ticket size, peak hours, and more. But to date, you’ve only been able to see your performance on one app at a time. Interesting? Sure. Actionable? Not really. That’s where solutions like Otter Analytics come in.
What is Otter Analytics?
Otter Analytics is a solution that allows you to track the performance of all your delivery orders across partners in real-time. It connects your delivery apps like Uber Eats, Just Eat, and Deliveroo to let you see a single, clear, actionable performance report. Think of our Analytics solution as the command center for your delivery business. It turns your performance data from a complicated pile of spreadsheets with conflicting numbers into a visual, actionable dashboard compatible with all web and mobile browsers.
Otter Analytics includes many reports like store performance, orders reporting, menu item reporting, lost sales analysis, and availability reports. Let’s look at 3 key reports you should be analysing to improve your restaurant’s delivery sales.
3 key reports to improve your restaurants delivery sales
1. Performance Report
Our Performance Report compiles historical data of your restaurant’s total sales. This information is critical to identify patterns, estimate future performance, and track the progress of your restaurant towards its goals. In general, Performance Reports show us how data changes over time, but it’s of little use unless you have the power to sort and view the numbers in the most impactful way for your restaurant. That’s why Otter’s Analytics solution allows you to filter performance across multiple parameters so you can dig into what’s working and what isn’t.
Do you work with Just Eat, Uber Eats, and Deliveroo? Filter your data by sales channel to review your performance on each delivery app. Do you have multiple locations? Filter and compare performance by store or brand. Want to know if it would be a good idea to offer a brunch menu? Filter by days and hours to identify when you see the most orders and when you could use some new traffic.
Otter's Performance Report with filters allows you to explore your performance across periods of time, delivery platforms, locations, brands, and more, so you can use your data just the way you need it.

How to access Otter's Performance Report
1. If you’re an Otter customer, log in to https://manager.tryotter.com/.
2. Go to the Reports tab and click on “View store performance report.”
3. Filter your data by date, brand, store, or sales channel.
4. Hit “Export” if you’d like to download the report.
Not an Otter customer yet? Get started for free here.
2. Lost Sales Report
Lost sales happen, but Otter’s Lost Sales Report helps you ensure they happen less often. Picture this: you’ve yet to sign-up for Otter (or you have Otter, but your Auto-Accept orders feature turned off), you’re “lunch rush busy” in-store, with 10 orders from Just Eat, 12 from Uber Eats, and 15 from Deliveroo.
Your team is stretched thin – thinner than usual, we should say – and you hear the incoming order notification sound ringing. Your host is walking someone to a table outside, your cooks are, well, cooking, the food runner is running a plate to a table in the back, your waiters are with customers… The notification sound continues to ring. You’re rushing behind the counter to press “accept” and… darn… too late.
You missed an order, and you know it’s bound to impact your bottom line. Missed orders, canceled orders, & negatively adjusted orders happen, but you can decrease the frequency at which they occur by digging into the Lost Sales Report within Otter.
Otter’s Lost Sales report lets you see the impact missed, canceled, and adjusted orders have on your bottom line while helping you identify how to eliminate order errors. Decrease your order errors to eliminate lost revenue with Otter’s Lost Sales report.

How to access Otter's Lost Sales Report
1. If you’re an Otter customer, log in to https://manager.tryotter.com/.
2. Go to the Reports tab and click on “View lost sales report.”
3. Filter your data by date, brand, store, or sales channel.
4. Hit “Export” if you’d like to download the report.
Not an Otter customer yet? Get started for free here.
3. Product & Modifier Report
Want to know the top menu items to build a killer menu? The Product & Modifier Report helps you gain insight into which items are performing best so you can optimise your menu to drive increased orders.
Find out what your customers love with the Top items by unit sold donut chart. This feature will help you adapt your menu to your customers preferences and skyrocket your sales.
This tool also reveals potential updates you can make to your menu to get more orders. Maybe your cheeseburger isn't ordered often on-premise. Still, it's a favourite on delivery: why not edit your menu to offer a bacon cheeseburger, veggie burger, and other item variations?
Maybe when summer arrives, the caesar salad is ordered more than the cheeseburger. No problem, you can easily adjust your menu as things change with a few simple clicks.
How to access Otter's Product & Modifier Report
1. If you're an Otter customer, log in to https://manager.tryotter.com/.
2. Go to the Reports tab and click on View product & modifier report.
3. Filter your data by date, brand, store, or sales channel.
4. Hit Export if you'd like to download the report.
Not an Otter customer yet? Get started for free here.
Exporting your performance data has never been easier
All the data will now be available for download via CSV and XLSX formats via the export function. You can export data in the table by clicking Export from the graph view or the blue download arrow from the table view.
The new Reports tool is free – what are you waiting for?
Great news! If you’re an Otter, your customers, your restaurant already has access to Otter’s new Reports.
If you’re not an Otter customer but made it this far, get started for free today! Say goodbye to messy spreadsheets & stop missing out on money through missed orders today.


