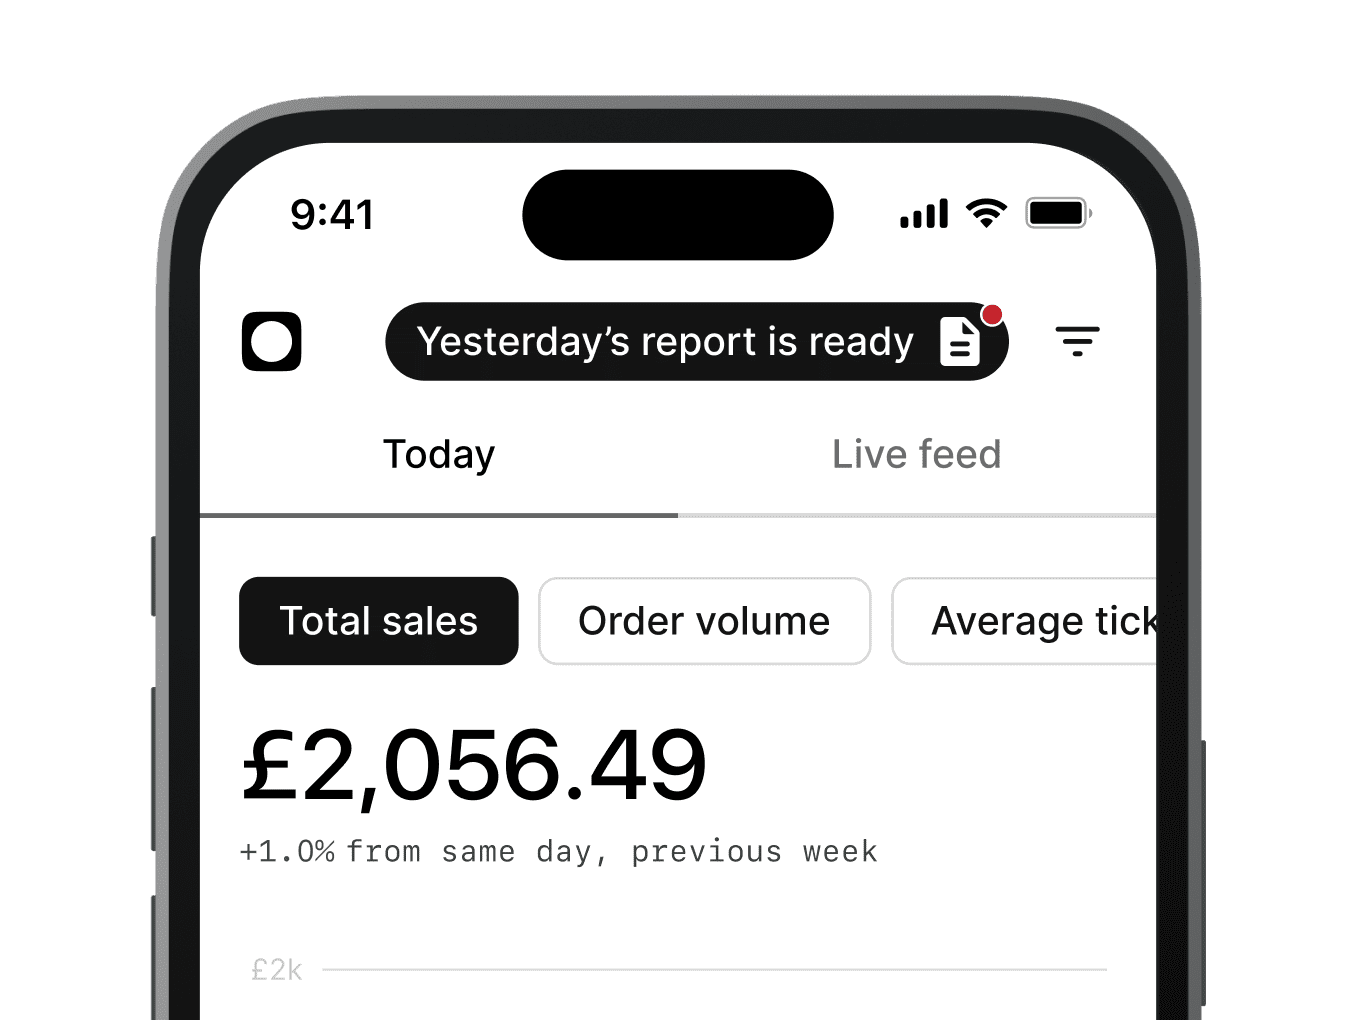
Find new ways to increase profits
Focus on serving great food while Otter analyses information from your entire restaurant, letting you know where and how to improve.

See everything in one place
Integrate your POS, delivery apps, and more to view all of your data at once. Save time from looking at dozens of different reports while still being able to zoom in or out per store.

Pinpoint what’s working and what’s not
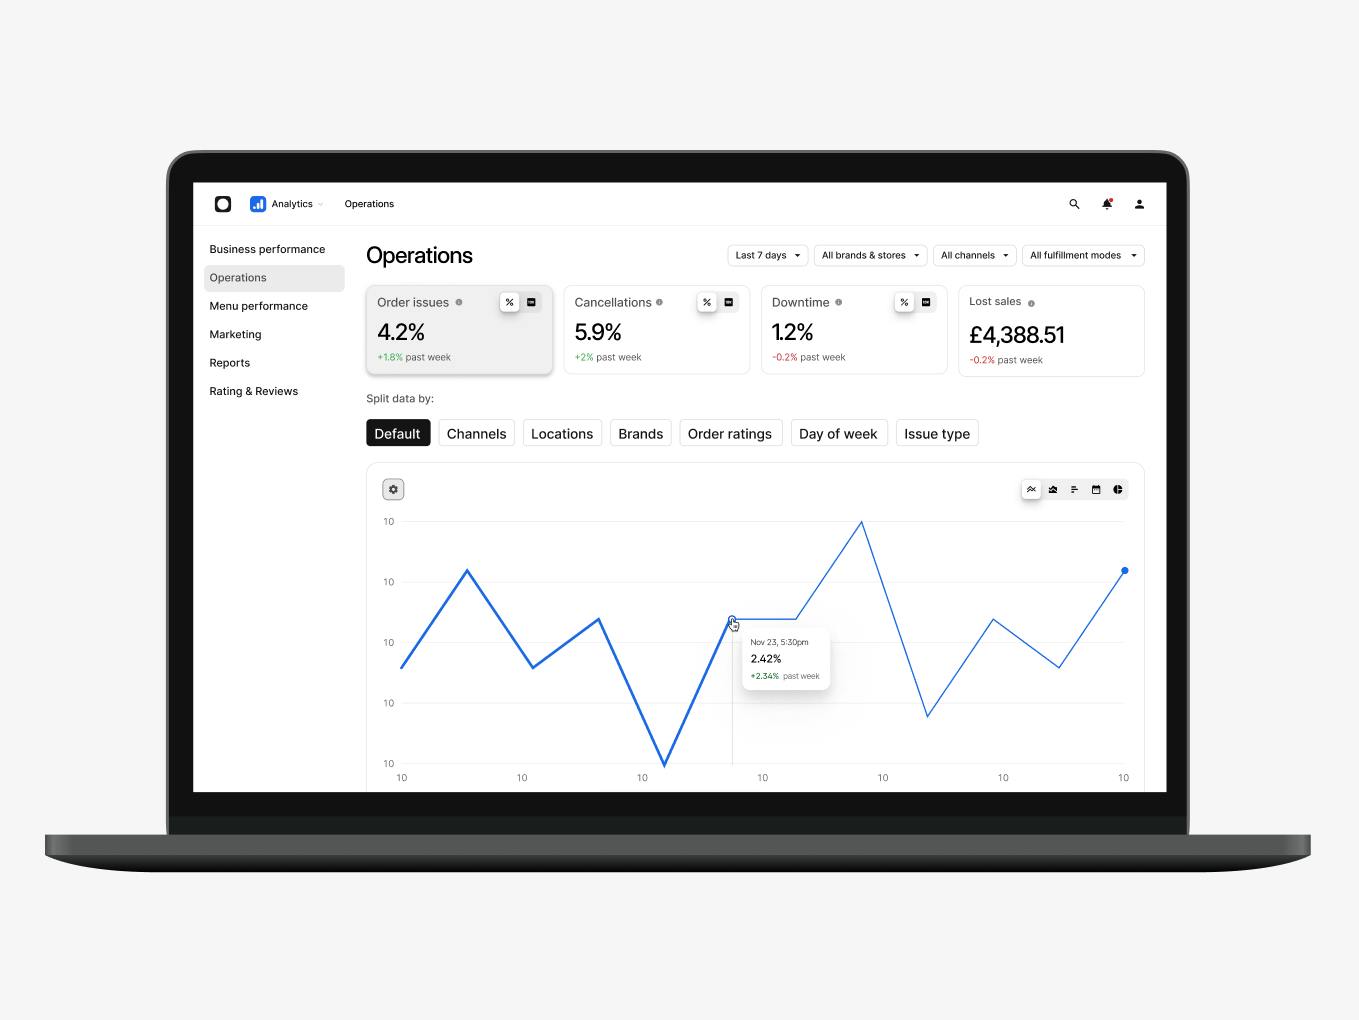
Easily identify opportunities to improve each area of your business from operations to marketing, menus, customer retention, and more.

Push promos to their peaks
Measure the impact of your delivery app promotions to understand their effects on sales. Refine your strategy to take your marketing investment even further.
Integrate everywhere
Otter integrates with nearly every third-party restaurant service so you can do more in less time. Manage menus, track deliveries, handoff orders, run promotions, analyse performance—you name it—with one dedicated platform.
Visualise success
Analytics helps you cut through dense data, unearthing insights and actionable steps to maximise your potential profits and growth.
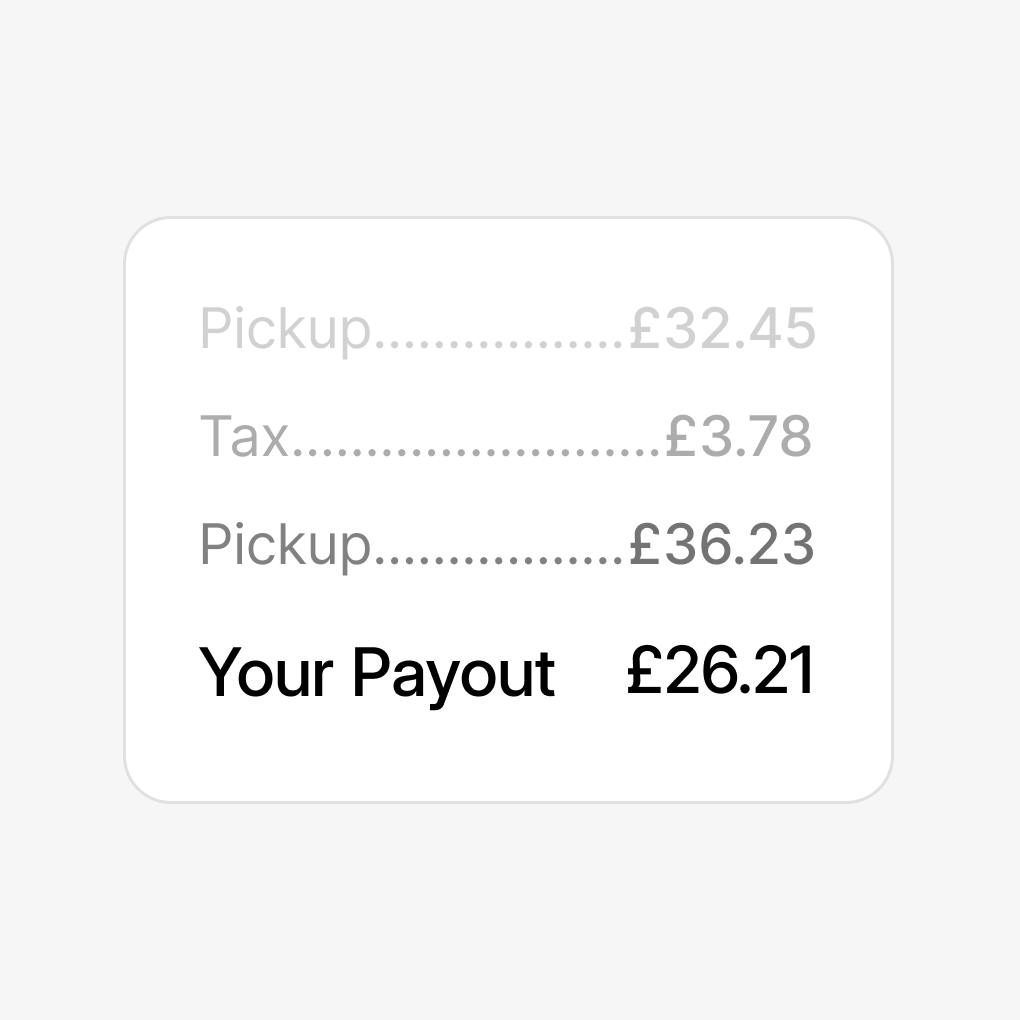
Consolidated reports
Combine all the information from different delivery partners, stores, brands and even POS systems in one single view so you don’t have to sift through various apps.
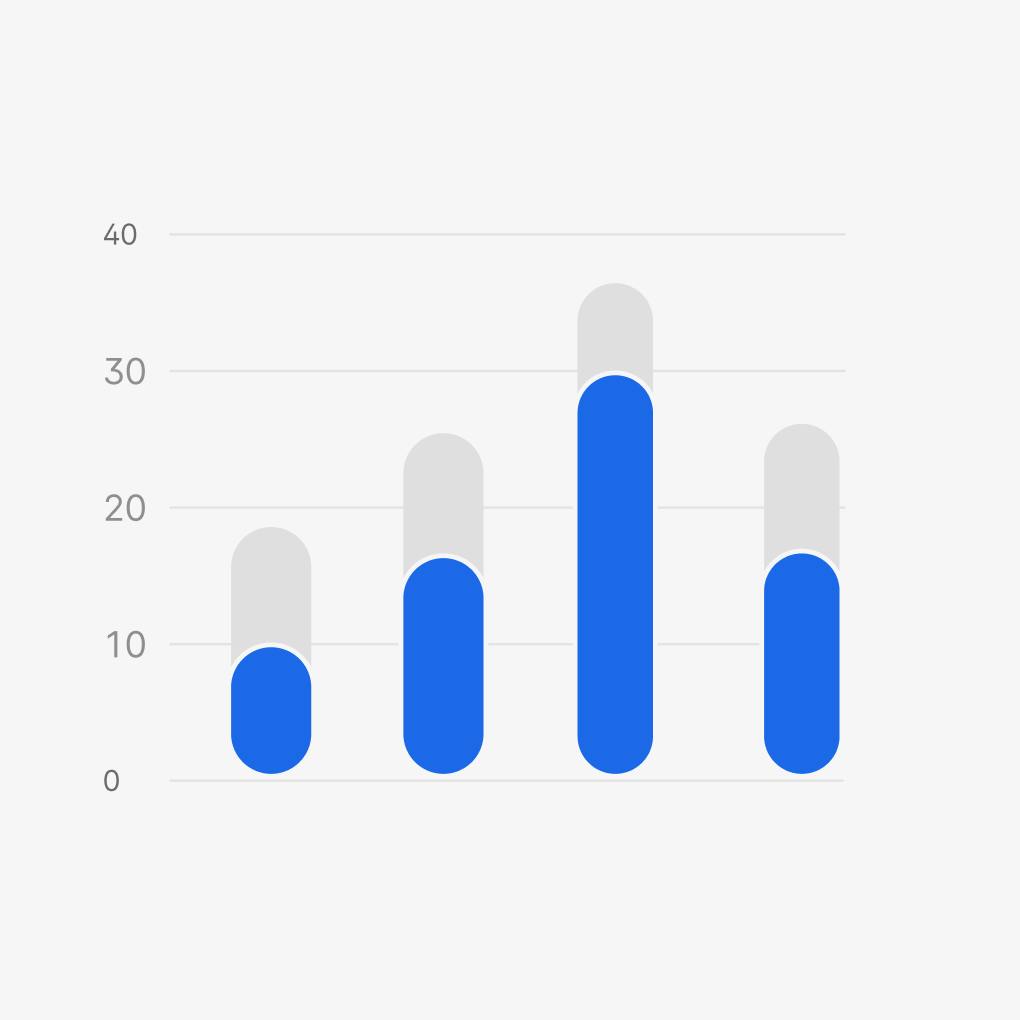
Digestible charts
Some services throw numbers on a chart. Otter consolidates info into actionable, easily-understood bites that read just as well on a printout as on-screen. You’ll always still have the option of digging deeper into the raw data with the tables in each report.
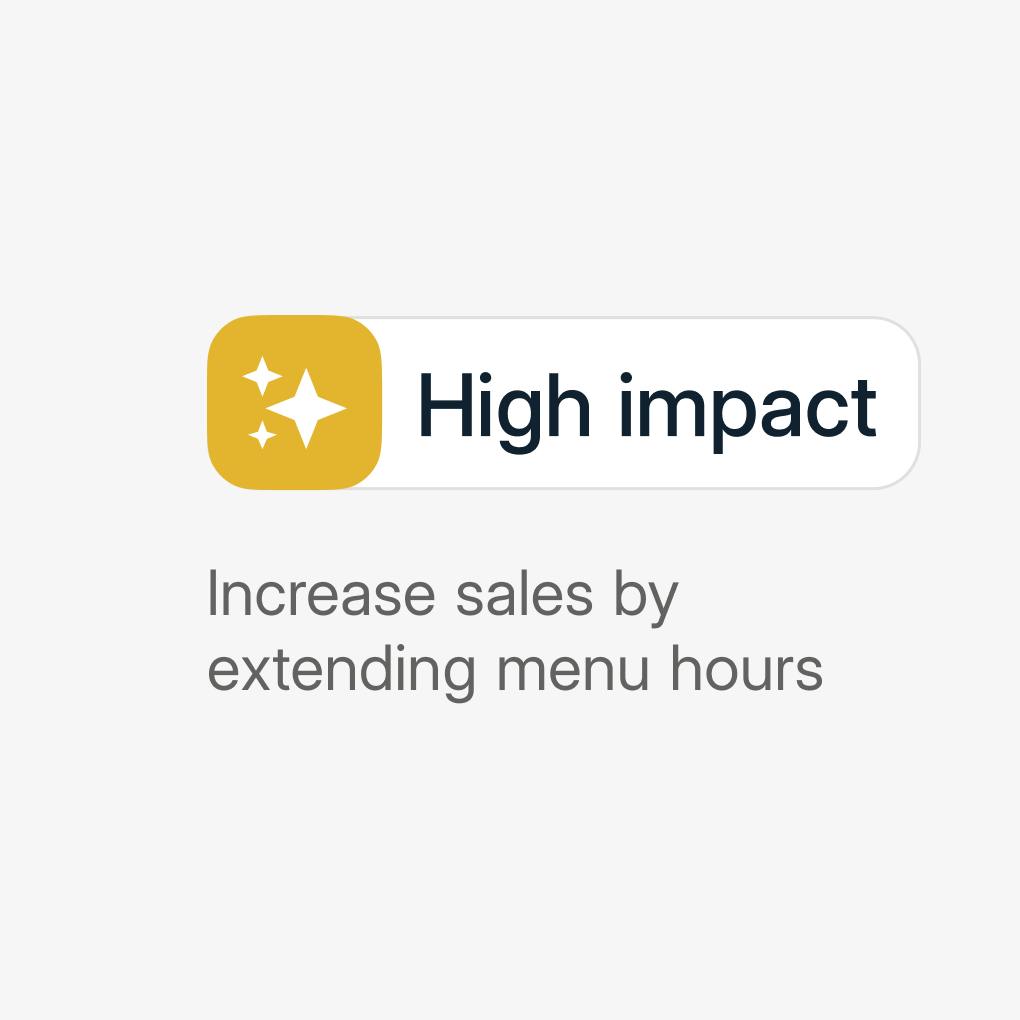
Highlights and lowlights
Each key metric is compared to the last 7 days, or any time period you select. That way, you’ll know if you’re actually improving or need to tweak your approach.
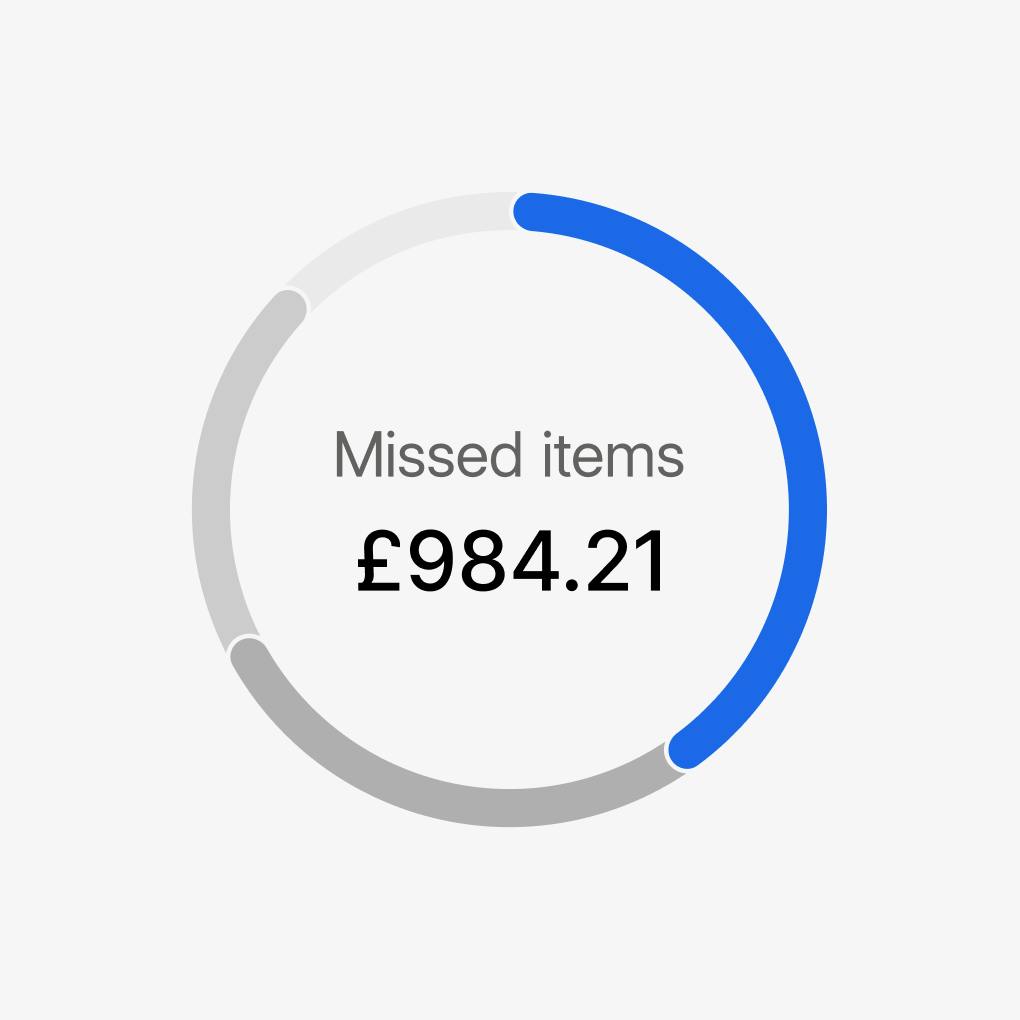
Sliced and diced data
Analytics shows you the most helpful ways the raw data just lying in your different tools can be made use of. Get ideas on what combos to offer customers, which promotions to run, and more just from the information you already have.
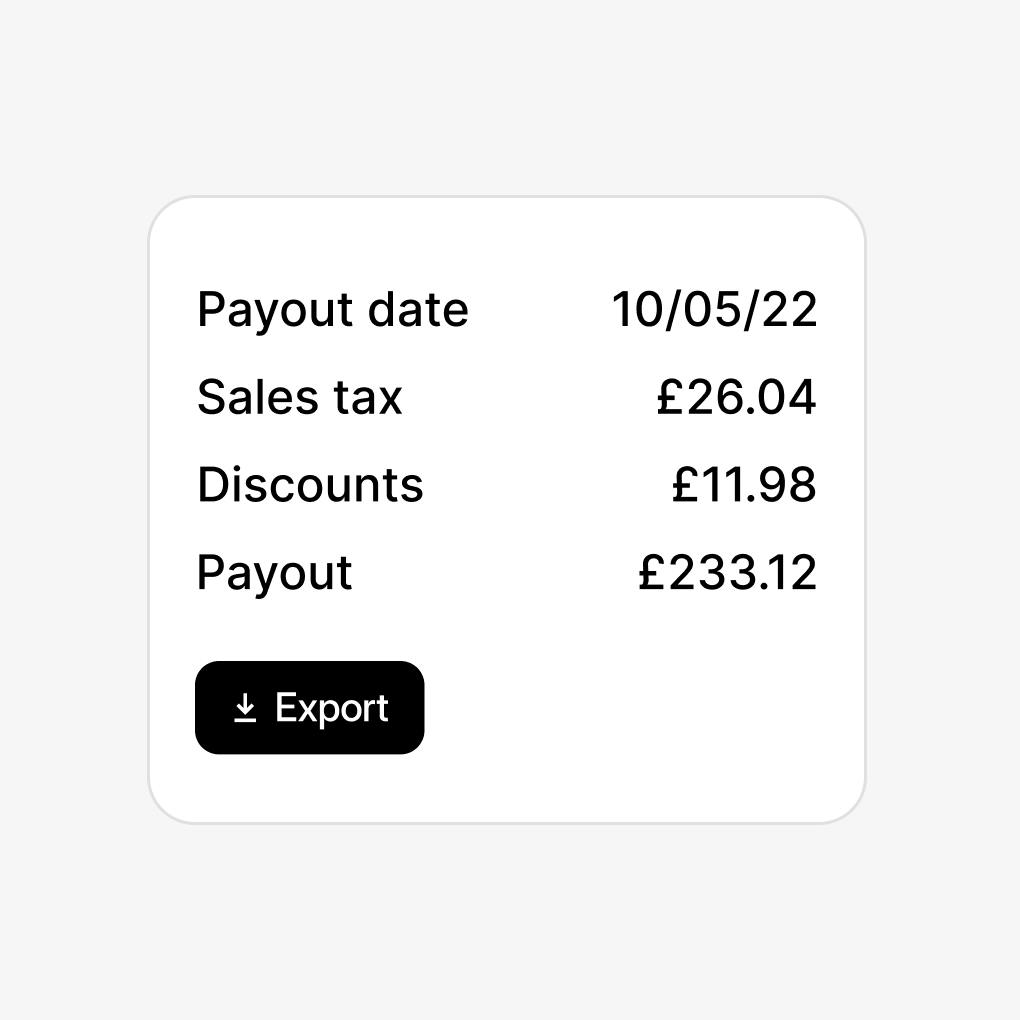
Downloadable formats
Build custom bite-sized reports that get sent to your inbox regularly. Easily export your reports as .CSV or .XLSX files for deeper analysis.
Our customers
I love the dashboard feature for analytics. Because we're always looking to see where we can do better in terms of orders. Having all the data analytics in one area, with one login, made my life so much easier.

Abby T.
Owner, Playa Bowls
Trusted by 275,000+ businesses big and small


